
Amongst all the excitement of a monumentally successful result for Keir Starmer’s Labour party, the news is paying only passing attention to what the results mean for the actual sentiments of the UK population, once we remove the absurdity of our First Past the Post system from the outcomes.
Below I have collated 6 insights that are immediately apparent from the underlying results data (I appreciate this is not entirely accurate as people may change their voting tactically under our system and would vote differently under a more proportional system, but this data is still a far better indicator than the number of seats won!)
Insight 1: Labour did NOT win the popular vote…
From the news it would seem that the Labour Party have reinvented themselves as a hugely popular party with support of over 60% of the population (412/650 seats).
In reality, by quite some margin, the most popular option was… nobody… This was the lowest turnout since the war and ~40% of those eligible to vote chose not to…

This is nothing new, but it has been getting steadily worse…

Note: This is the main thing that seems to be overlooked by the majority of the press. The turnout is reported, but historical comparisons then ignore it and use percentages of those who cast a vote, meaning we are given results based on popularity without factoring in the significant portion of the population who choose not to take part in the popularity contest.
The insights below are all based on percentages of those eligible to cast a vote, which aims to capture the true popularity, factoring in the critical factor of voter apathy.
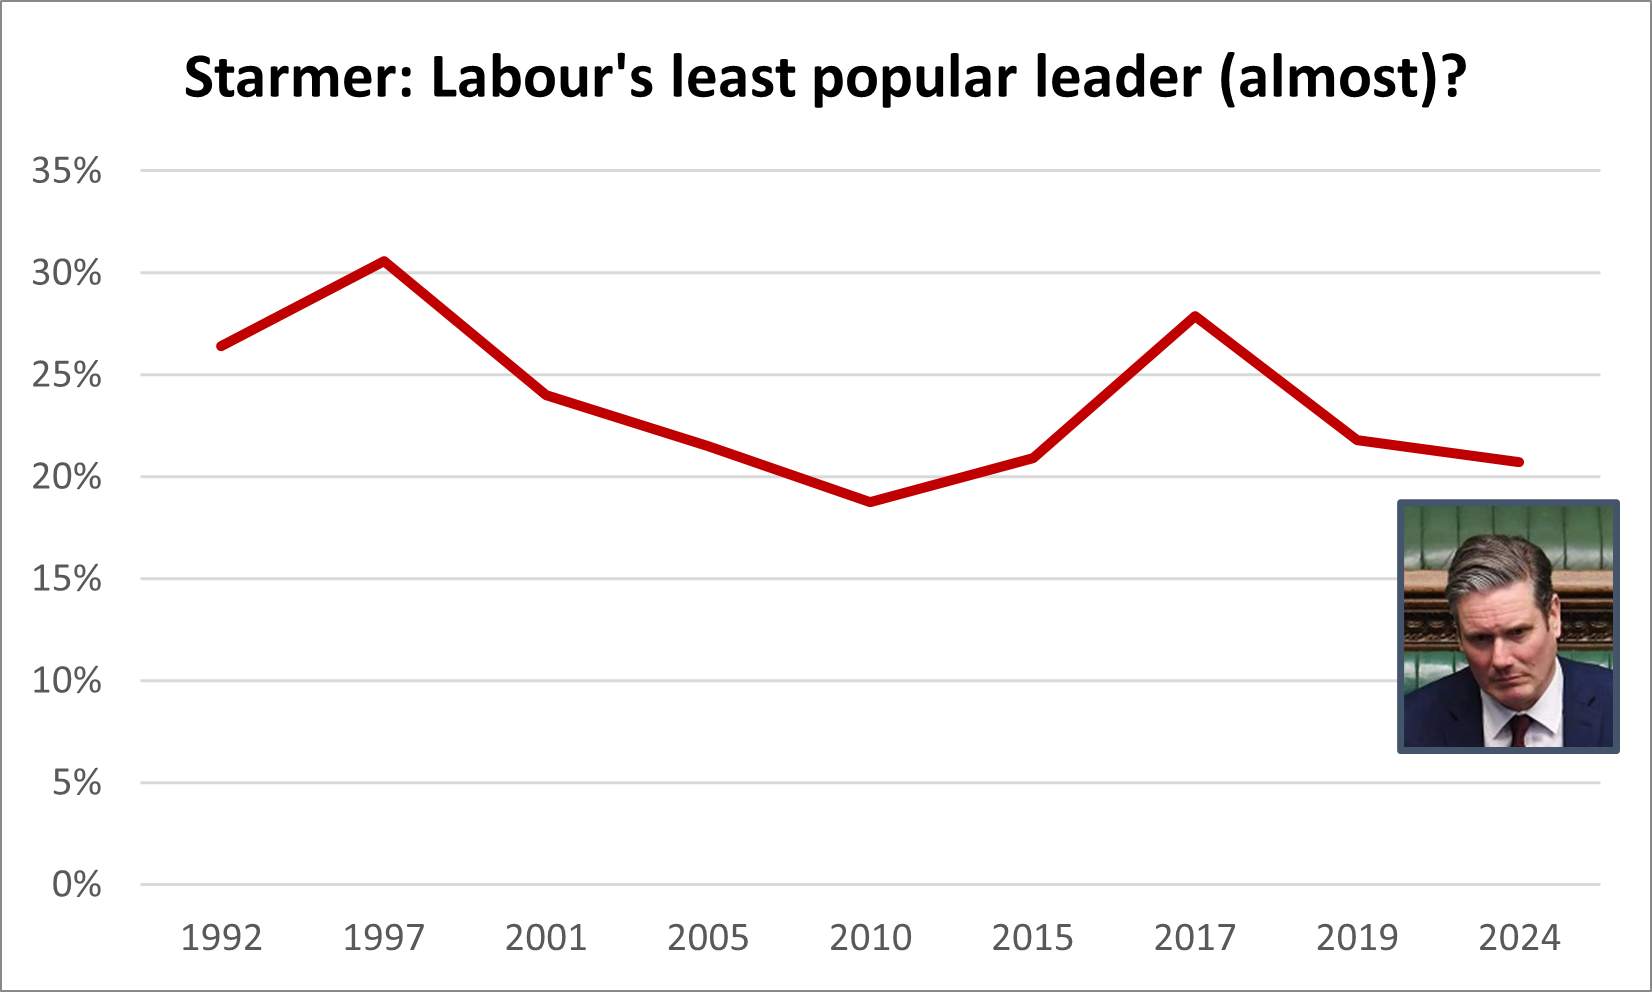
Insight 2: 2024 was actually a low point for Labour’s popularity
Despite winning an almost record number of seats, Labour only polled 21% of eligible voters, the second lowest level since 1992 (only Gordon Brown in 2010 was worse at 19%) – this is barely half the number that chose not to vote at all!
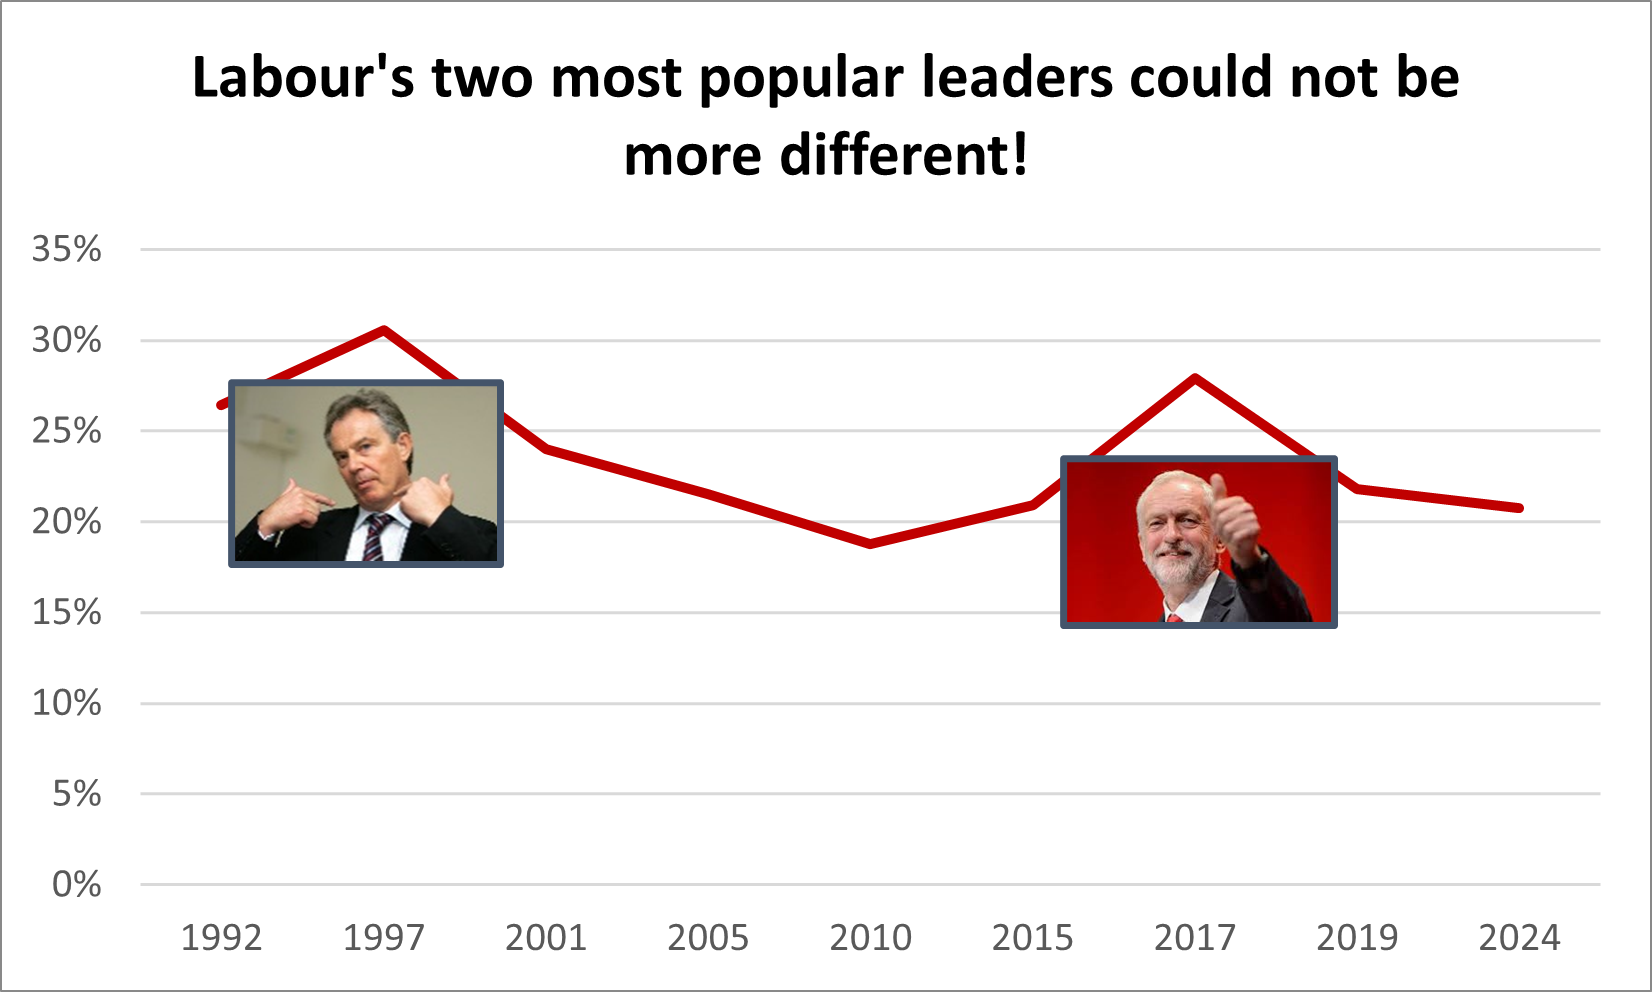
Insight 3: Labour’s most popular leaders with the public – the results may surprise you!
On the other hand, judged on the same criteria of their popularity among the total population that is eligible to vote, not just those who cast their vote… The same results show two clear peaks – 1997 (31%) and 2017 (28%).
Who were these Labour leaders?
Counter to what accepted history tells us… the most popular leaders were Tony Blair and . . . Jeremy Corbyn! (even Neil Kinnock who famously crashed and burned in 1992 won 26% of votes of eligible voters, 5% more than Starmer!)
So, the largest popular vote went to the most right-wing and the most left-wing leaders of recent times, whose similar levels of popularity led to such wildly different election outcomes…
Insight 4: The rise of the far right is not a new phenomenon
Reform may seem like a newcomer, or a flash in the pan but they are actually the continuation of a long line of similar right-wing populist parties – Brexit, UKIP etc. – with roots as far back as the National Front in the 1970s.
Looking at the results of this collection of parties together shows the slow and steady resurgence since the 1990s with a brief blip in the 2017-19 elections (perhaps because the Tory party had hijacked many of their policies)

So, while their newfound effectiveness in winning actual seats is of course very concerning, the underlying sympathies of the population have been on a consistent rise for a long time – this is far more worrying than the results of a single election.
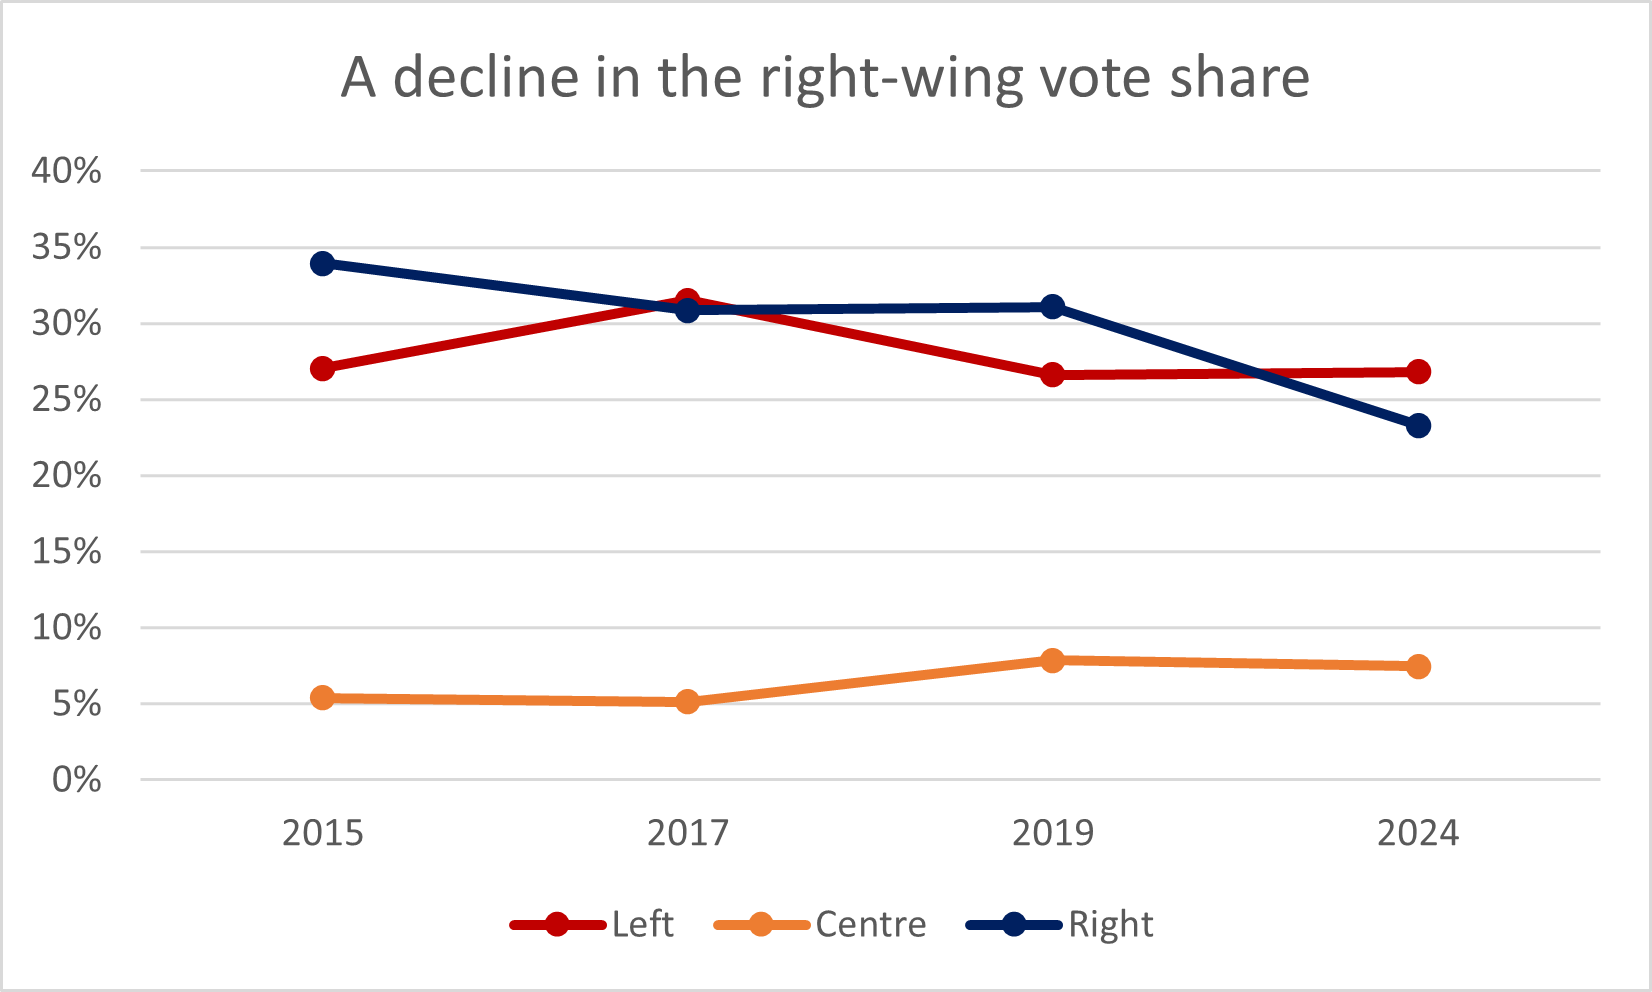
Insight 5: Overall, the right-wing vote has actually been declining since 2015
Interestingly, despite the rise in the far-right parties, if we amalgamate the statistics for left/right leaning parties, we can see that, while the left and centrist vote has remained largely consistent since 2015, votes for the combination of right-wing parties have dropped significantly. This cannot be explained by a shift from the Conservatives to Reform or the Lib Dems; could it demonstrate a general dissatisfaction with the politics of the right?
Insight 6: The meteoric rise of the Green Party – might they be the new left?
The rise of the green party is covered in the press, but the scale of the increase seems not to be being paid sufficient attention.
Since 1992, the green share of the eligible voter population has increased from 0.4% to over 4% – a ten-fold increase! While it is entirely unscientific, the chart below speculates as to what would happen if we extend this exponential rise into the future – showing the Greens earning nearly 4 million votes in a few elections time… Even with no change to our FPTP system, following recent experience of the Lib Dems, this could translate to 10 seats or to 70+ seats, a powerful electoral force.

This rise if of course in part due to increased worry about the climate crisis, but I wonder if another factor is the disappearance of the Labour Party as a genuinely left-wing political voice, leaving the Greens as the only viable progressive alternative…?
Given the recent decline in the right-wing vote is quite likely due to the increase in non-voters, and could quite easily be turned around by a reformed Tory party… could a party that combines the climate vote and overlooked left wing voters do the same and manage to achieve a massive increase in progressive voter turnout…?
Let us hope so as the Labour party show little to appeal to the more progressive voter and, if the Tories and Reform party resolve their issues or unite, a progressive alliance of Labour/Green (and perhaps the centrist Lib Dems for good measure) could be the only thing saving us from a slow decline to the right-wing populism that is taking root in Europe.
This article is a follow-up to a similar data-driven piece I wrote after the 2017 election. All data is freely available and sourced from a combination of Wikipedia, Office of National Statistics and the House of Commons Library.
